FvgObject█ OVERVIEW
This library provides a suite of methods designed to manage the visual representation and lifecycle of Fair Value Gap (FVG) objects on a Pine Script™ chart. It extends the `fvgObject` User-Defined Type (UDT) by attaching object-oriented functionalities for drawing, updating, and deleting FVG-related graphical elements. The primary goal is to encapsulate complex drawing logic, making the main indicator script cleaner and more focused on FVG detection and state management.
█ CONCEPTS
This library is built around the idea of treating each Fair Value Gap as an "object" with its own visual lifecycle on the chart. This is achieved by defining methods that operate directly on instances of the `fvgObject` UDT.
Object-Oriented Approach for FVGs
Pine Script™ v6 introduced the ability to define methods for User-Defined Types (UDTs). This library leverages this feature by attaching specific drawing and state management functions (methods) directly to the `fvgObject` type. This means that instead of calling global functions with an FVG object as a parameter, you call methods *on* the FVG object itself (e.g., `myFvg.updateDrawings(...)`). This approach promotes better code organization and a more intuitive way to interact with FVG data.
FVG Visual Lifecycle Management
The core purpose of this library is to manage the complete visual journey of an FVG on the chart. This lifecycle includes:
Initial Drawing: Creating the first visual representation of a newly detected FVG, including its main box and optionally its midline and labels.
State Updates & Partial Fills: Modifying the FVG's appearance as it gets partially filled by price. This involves drawing a "mitigated" portion of the box and adjusting the `currentTop` or `currentBottom` of the remaining FVG.
Full Mitigation & Tested State: Handling how an FVG is displayed once fully mitigated. Depending on user settings, it might be hidden, or its box might change color/style to indicate it has been "tested." Mitigation lines can also be managed (kept or deleted).
Midline Interaction: Visually tracking if the price has touched the FVG's 50% equilibrium level (midline).
Visibility Control: Dynamically showing or hiding FVG drawings based on various criteria, such as user settings (e.g., hide mitigated FVGs, timeframe-specific visibility) or external filters (e.g., proximity to current price).
Deletion: Cleaning up all drawing objects associated with an FVG when it's no longer needed or when settings dictate its removal.
Centralized Drawing Logic
By encapsulating all drawing-related operations within the methods of this library, the main indicator script is significantly simplified. The main script can focus on detecting FVGs and managing their state (e.g., in arrays), while delegating the complex task of rendering and updating them on the chart to the methods herein.
Interaction with `fvgObject` and `drawSettings` UDTs
All methods within this library operate on an instance of the `fvgObject` UDT. This `fvgObject` holds not only the FVG's price/time data and state (like `isMitigated`, `currentTop`) but also the IDs of its associated drawing elements (e.g., `boxId`, `midLineId`).
The appearance of these drawings (colors, styles, visibility, etc.) is dictated by a `drawSettings` UDT instance, which is passed as a parameter to most drawing-related methods. This `drawSettings` object is typically populated from user inputs in the main script, allowing for extensive customization.
Stateful Drawing Object Management
The library's methods manage Pine Script™ drawing objects (boxes, lines, labels) by storing their IDs within the `fvgObject` itself (e.g., `fvgObject.boxId`, `fvgObject.mitigatedBoxId`, etc.). Methods like `draw()` create these objects and store their IDs, while methods like `updateDrawings()` modify them, and `deleteDrawings()` removes them using these stored IDs.
Drawing Optimization
The `updateDrawings()` method, which is the most comprehensive drawing management function, incorporates optimization logic. It uses `prev_*` fields within the `fvgObject` (e.g., `prevIsMitigated`, `prevCurrentTop`) to store the FVG's state from the previous bar. By comparing the current state with the previous state, and also considering changes in visibility or relevant drawing settings, it can avoid redundant and performance-intensive drawing operations if nothing visually significant has changed for that FVG.
█ METHOD USAGE AND WORKFLOW
The methods in this library are designed to be called in a logical sequence as an FVG progresses through its lifecycle. A crucial prerequisite for all visual methods in this library is a properly populated `drawSettings` UDT instance, which dictates every aspect of an FVG's appearance, from colors and styles to visibility and labels. This `settings` object must be carefully prepared in the main indicator script, typically based on user inputs, before being passed to these methods.
Here’s a typical workflow within a main indicator script:
1. FVG Instance Creation (External to this library)
An `fvgObject` instance is typically created by functions in another library (e.g., `FvgCalculations`) when a new FVG pattern is identified. This object will have its core properties (top, bottom, startTime, isBullish, tfType) initialized.
2. Initial Drawing (`draw` method)
Once a new `fvgObject` is created and its initial visibility is determined:
Call the `myFvg.draw(settings)` method on the new FVG object.
`settings` is an instance of the `drawSettings` UDT, containing all relevant visual configurations.
This method draws the primary FVG box, its midline (if enabled in `settings`), and any initial labels. It also initializes the `currentTop` and `currentBottom` fields of the `fvgObject` if they are `na`, and stores the IDs of the created drawing objects within the `fvgObject`.
3. Per-Bar State Updates & Interaction Checks
On each subsequent bar, for every active `fvgObject`:
Interaction Check (External Logic): It's common to first use logic (e.g., from `FvgCalculations`' `fvgInteractionCheck` function) to determine if the current bar's price interacts with the FVG.
State Field Updates (External Logic): Before calling the `FvgObjectLib` methods below, ensure that your `fvgObject`'s state fields (such as `isMitigated`, `currentTop`, `currentBottom`, `isMidlineTouched`) are updated using the current bar's price data and relevant functions from other libraries (e.g., `FvgCalculations`' `checkMitigation`, `checkPartialMitigation`, etc.). This library's methods render the FVG based on these pre-updated state fields.
If interaction occurs and the FVG is not yet fully mitigated:
Full Mitigation Update (`updateMitigation` method): Call `myFvg.updateMitigation(high, low)`. This method updates `myFvg.isMitigated` and `myFvg.mitigationTime` if full mitigation occurs, based on the interaction determined by external logic.
Partial Fill Update (`updatePartialFill` method): If not fully mitigated, call `myFvg.updatePartialFill(high, low, settings)`. This method updates `myFvg.currentTop` or `myFvg.currentBottom` and adjusts drawings to show the filled portion, again based on prior interaction checks and fill level calculations.
Midline Touch Check (`checkMidlineTouch` method): Call `myFvg.checkMidlineTouch(high, low)`. This method updates `myFvg.isMidlineTouched` if the price touches the FVG's 50% level.
4. Comprehensive Visual Update (`updateDrawings` method)
After the FVG's state fields have been potentially updated by external logic and the methods in step 3:
Call `myFvg.updateDrawings(isVisibleNow, settings)` on each FVG object.
`isVisibleNow` is a boolean indicating if the FVG should currently be visible.
`settings` is the `drawSettings` UDT instance.
This method synchronizes the FVG's visual appearance with its current state and settings, managing all drawing elements (boxes, lines, labels), their styles, and visibility. It efficiently skips redundant drawing operations if the FVG's state or visibility has not changed, thanks to its internal optimization using `prev_*` fields, which are also updated by this method.
5. Deleting Drawings (`deleteDrawings` method)
When an FVG object is no longer tracked:
Call `myFvg.deleteDrawings(deleteTestedToo)`.
This method removes all drawing objects associated with that `fvgObject`.
This workflow ensures that FVG visuals are accurately maintained throughout their existence on the chart.
█ NOTES
Dependencies: This library relies on `FvgTypes` for `fvgObject` and `drawSettings` definitions, and its methods (`updateMitigation`, `updatePartialFill`) internally call functions from `FvgCalculations`.
Drawing Object Management: Be mindful of TradingView's limits on drawing objects per script. The main script should manage the number of active FVG objects.
Performance and `updateDrawings()`: The `updateDrawings()` method is comprehensive. Its internal optimization (checking `hasStateChanged` based on `prev_*` fields) is crucial for performance. Call it judiciously.
Role of `settings.currentTime`: The `currentTime` field in `drawSettings` is key for positioning time-dependent elements like labels and the right edge of non-extended drawings.
Mutability of `fvgObject` Instances: Methods in this library directly modify the `fvgObject` instance they are called upon (e.g., its state fields and drawing IDs).
Drawing ID Checks: Methods generally check if drawing IDs are `na` before acting on them, preventing runtime errors.
█ EXPORTED FUNCTIONS
method draw(this, settings)
Draws the initial visual representation of the FVG object on the chart. This includes the main FVG box, its midline (if enabled), and a label
(if enabled for the specific timeframe). This method is typically invoked
immediately after an FVG is first detected and its initial properties are set. It uses drawing settings to customize the appearance based on the FVG's timeframe type.
Namespace types: types.fvgObject
Parameters:
this (fvgObject type from no1x/FvgTypes/1) : The FVG object instance to be drawn. Core properties (top, bottom,
startTime, isBullish, tfType) should be pre-initialized. This method will
initialize boxId, midLineId, boxLabelId (if applicable), and
currentTop/currentBottom (if currently na) on this object.
settings (drawSettings type from no1x/FvgTypes/1) : A drawSettings object providing all visual parameters. Reads display settings (colors, styles, visibility for boxes, midlines, labels,
box extension) relevant to this.tfType. settings.currentTime is used for
positioning labels and the right boundary of non-extended boxes.
method updateMitigation(this, highVal, lowVal)
Checks if the FVG has been fully mitigated by the current bar's price action.
Namespace types: types.fvgObject
Parameters:
this (fvgObject type from no1x/FvgTypes/1) : The FVG object instance. Reads this.isMitigated, this.isVisible,
this.isBullish, this.top, this.bottom. Updates this.isMitigated and
this.mitigationTime if full mitigation occurs.
highVal (float) : The high price of the current bar, used for mitigation check.
lowVal (float) : The low price of the current bar, used for mitigation check.
method updatePartialFill(this, highVal, lowVal, settings)
Checks for and processes partial fills of the FVG.
Namespace types: types.fvgObject
Parameters:
this (fvgObject type from no1x/FvgTypes/1) : The FVG object instance. Reads this.isMitigated, this.isVisible,
this.isBullish, this.currentTop, this.currentBottom, original this.top/this.bottom,
this.startTime, this.tfType, this.isLV. Updates this.currentTop or
this.currentBottom, creates/updates this.mitigatedBoxId, and may update this.boxId's
top/bottom to reflect the filled portion.
highVal (float) : The high price of the current bar, used for partial fill check.
lowVal (float) : The low price of the current bar, used for partial fill check.
settings (drawSettings type from no1x/FvgTypes/1) : The drawing settings. Reads timeframe-specific colors for mitigated
boxes (e.g., settings.mitigatedBullBoxColor, settings.mitigatedLvBullColor),
box extension settings (settings.shouldExtendBoxes, settings.shouldExtendMtfBoxes, etc.),
and settings.currentTime to style and position the mitigatedBoxId and potentially adjust the main boxId.
method checkMidlineTouch(this, highVal, lowVal)
Checks if the FVG's midline (50% level or Equilibrium) has been touched.
Namespace types: types.fvgObject
Parameters:
this (fvgObject type from no1x/FvgTypes/1) : The FVG object instance. Reads this.midLineId, this.isMidlineTouched,
this.top, this.bottom. Updates this.isMidlineTouched if a touch occurs.
highVal (float) : The high price of the current bar, used for midline touch check.
lowVal (float) : The low price of the current bar, used for midline touch check.
method deleteDrawings(this, deleteTestedToo)
Deletes all visual drawing objects associated with this FVG object.
Namespace types: types.fvgObject
Parameters:
this (fvgObject type from no1x/FvgTypes/1) : The FVG object instance. Deletes drawings referenced by boxId,
mitigatedBoxId, midLineId, mitLineId, boxLabelId, mitLineLabelId,
and potentially testedBoxId, keptMitLineId. Sets these ID fields to na.
deleteTestedToo (simple bool) : If true, also deletes drawings for "tested" FVGs
(i.e., testedBoxId and keptMitLineId).
method updateDrawings(this, isVisibleNow, settings)
Manages the comprehensive update of all visual elements of an FVG object
based on its current state (e.g., active, mitigated, partially filled) and visibility. It handles the drawing, updating, or deletion of FVG boxes (main and mitigated part),
midlines, mitigation lines, and their associated labels. Visibility is determined by the isVisibleNow parameter and relevant settings
(like settings.shouldHideMitigated or timeframe-specific show flags). This method is central to the FVG's visual lifecycle and includes optimization
to avoid redundant drawing operations if the FVG's relevant state or appearance
settings have not changed since the last bar. It also updates the FVG object's internal prev_* state fields for future optimization checks.
Namespace types: types.fvgObject
Parameters:
this (fvgObject type from no1x/FvgTypes/1) : The FVG object instance to update. Reads most state fields (e.g.,
isMitigated, currentTop, tfType, etc.) and updates all drawing ID fields
(boxId, midLineId, etc.), this.isVisible, and all this.prev_* state fields.
isVisibleNow (bool) : A flag indicating whether the FVG should be currently visible. Typically determined by external logic (e.g., visual range filter). Affects
whether active FVG drawings are created/updated or deleted by this method.
settings (drawSettings type from no1x/FvgTypes/1) : A fully populated drawSettings object. This method extensively
reads its fields (colors, styles, visibility toggles, timeframe strings, etc.)
to render FVG components according to this.tfType and current state. settings.currentTime is critical for positioning elements like labels and extending drawings.
Wyszukaj w skryptach "fair value gap"

ICT Turtle Soup Ultimate V2📜 ICT Turtle Soup Ultimate V2 — Advanced Liquidity Reversal System
Overview:
The ICT Turtle Soup Ultimate V2 is a next-generation liquidity reversal indicator built on the principles of smart money concepts (SMC) and the classic ICT Turtle Soup setup. It is designed to detect false breakouts (liquidity grabs) at key swing points, enhanced by proprietary logic that filters out low-quality signals using a combination of trend context, kill zone timing, candle wick behavior, and multi-timeframe imbalance zones.
This tool is ideal for intraday traders seeking high-probability entry signals near liquidity pools and imbalance zones — where smart money makes its move.
🔍 What This Script Does
🧠 Liquidity Grab Detection (Turtle Soup Core Logic)
The script scans for recent swing highs/lows using a user-defined lookback.
A signal is generated when price breaks above/below a previous swing level but closes back inside — indicating a liquidity run and likely reversal.
A special Wick Trap Mode enhances this logic by detecting long-wick fakeouts — where the wick grabs stops but the candle body closes opposite the breakout direction.
📉 Trend Filter with ATR Buffer
Optional trend filter uses a simple moving average (SMA) to gauge market direction.
Instead of hard filtering, it applies an ATR-based buffer to allow for entries near the trend line, reducing signal suppression from micro-fluctuations.
🕰️ Kill Zone Session Filtering
Only show signals during institutional trading hours:
London Session
New York AM
Or any custom user-defined session
Helps traders avoid low-volume hours and focus on where stop hunts and price expansions typically occur.
🧱 Multi-Timeframe FVG Confluence (Optional)
Signal validation is strengthened by checking if price is within a higher timeframe Fair Value Gap — commonly used to identify imbalances or inefficiencies.
Filters out setups that lack underlying displacement or order flow justification.
🎨 Visual Feedback
Plots 🔺 bullish and 🔻 bearish markers at signal candles.
Optionally displays:
Swing High/Low Labels (SH / SL)
Reversal distance labels
Background color shading on valid signals
Includes built-in alerts for automated trade notification.
🔑 Unique Benefits
Wick Trap Detection: A proprietary approach to detecting stop hunts via wick behavior, not just candle closes.
ATR-based trend filtering: Avoids unnecessary filtering while still maintaining directional bias.
All-in-one system: No need to stack multiple indicators — swing detection, reversal logic, session filtering, and imbalance confirmation are all integrated.
💡 How to Use
Enable Wick Trap Mode to detect stealthy liquidity grabs with strong wicks.
Use Kill Zone filters to trade only when institutions are active.
Optionally enable FVG confluence to improve confidence in reversal zones.
Watch for Bullish signals near SL levels and Bearish signals near SH levels.
Combine with your own execution strategy or other SMC tools for optimal results.
🔗 Best Used With:
Maximize your edge by combining this script with complementary SMC-based tools:
✅ First FVG — Opening Range Fair Value Gap Detector
✅ ICT SMC Liquidity Grabs + OB + Fibonacci OTE Levels
✅ Liquidity Levels — Smart Swing Highs and Lows with horizontal line projections

FVG, Swing, Target, D/W/M High Low Detector Basic by Trader Riaz"FVG, Swing, Target, D/W/M High Low Detector Basic by Trader Riaz " is a powerful TradingView indicator designed to enhance your trading strategy by identifying key market structures and levels. This all-in-one tool detects Fair Value Gaps (FVGs), Swing Highs/Lows, and previous Day, Previous Week, and Previous Month Highs/Lows, helping traders make informed decisions with ease.
Key Features:
Bullish & Bearish FVG Detection: Highlights Fair Value Gaps with customizable colors, labels, and extension options.
Swing Highs & Lows: Automatically detects and marks Swing Highs and Lows with adjustable display settings and extensions.
Next Target Levels: Identifies potential price targets based on market direction (rising or falling).
Daily, Weekly, and Monthly High/Low Levels: Displays previous day, week, and month highs/lows with customizable colors.
Customizable Settings: Fully adjustable inputs for colors, number of levels to display, and extension periods.
Clean Visuals: Intuitive and non-intrusive design with dashed lines, labels, and tooltips for better chart readability.
This indicator is ideal for traders looking to identify key price levels, improve market structure analysis, and enhance their trading strategies.
Happy Trading,
Trader Riaz

Wyckoff Range Detector [Beta] + Smart Money ElementsThis indicator detects the key phases of the Wyckoff market structure and integrates smart money elements, such as Order Blocks (OB), Fair Value Gaps (FVG), and Breaker Blocks. It also helps identify potential reversal zones (LPS, UTAD, Spring), breakout opportunities, and provides automatic Risk-Reward (R:R) calculations.
Key Features:
Wyckoff Phases Detection:
Automatically detects key phases of Wyckoff's market structure:
B (Range) – The initial range of accumulation.
C (Spring Phase) – Accumulation phase with a potential breakout.
C (UTAD Phase) – Upthrust After Distribution, indicating a potential reversal.
D (LPS Phase) – Last Point of Support, signaling accumulation before a breakout.
E (Breakout) – Phase marking breakout from range.
Re-Accumulation – Possible continuation in the range after a breakout.
Re-Distribution – Possible breakdown of a distribution phase.
Smart Money Elements:
Order Blocks (OB): Identifies Bullish and Bearish OBs to anticipate market entries.
Fair Value Gap (FVG): Highlights imbalance areas where price is likely to return.
Breaker Blocks: Marks areas where the price has previously broken a structure, indicating strong supply/demand zones.
Automatic Risk-Reward Calculation:
Smart RR: Automatically calculates Risk-Reward (R:R) ratios from LPS phases and Order Blocks. It draws lines to indicate target and stop levels with green for the target and red for the stop.
Visual representation of the entry signal with target and stop levels displayed.
Alerts:
Set alerts for phase changes, breakout, re-accumulation, or re-distribution to stay updated on the market’s movements.
Visual Tools:
Labels are used to indicate key zones such as AR, SC, LPS, and Spring Zones.
Draw boxes for the Spring and LPS phases to highlight areas where price action is likely to reverse.
Lines to represent potential breakouts, with customizable risk-reward indicators.
How to Use:
Apply the Indicator on any chart.
Identify Wyckoff phases to understand market trends.
Monitor Smart Money Elements (OB, FVG, Breaker) for entry and exit points.
Use automatic Risk-Reward levels for managing trades.
Set alerts for various Wyckoff phases and smart money signals to stay updated.

Pipsttocra Technical Patterns: EV HV FVG & OBPipstocrat Technical Patterns , identifies and visualizes key technical analysis patterns and structures on a TradingView chart. Here's a simple breakdown of what it does:
Fair Value Gaps (FVG):
Detects and highlights bullish and bearish Fair Value Gaps as colored boxes.
Adds centerline markers to indicate potential price levels.
Order Blocks (OB):
Identifies bullish and bearish order blocks (areas of significant buying or selling).
Displays them as colored rectangles extending to the right of the chart.
Candlestick Patterns:
Detects Engulfing Patterns (bullish and bearish) with volume confirmation.
Highlights Hammer and Inverted Hammer patterns with customizable shapes and colors.
Customization Options:
Allows users to adjust colors, sizes, and styles for all patterns and structures.
Provides options to show/hide specific patterns like FVGs, engulfing candles, hammers, etc.
Alerts:
Generates alerts for detected patterns, such as FVGs, order blocks, engulfing candles, and confluence zones (combination of FVGs and order blocks).
Management Features:
Automatically removes older or "filled" patterns (optional).
Tracks and updates patterns dynamically as new bars form.
Purpose:
This tool helps traders spot high-probability trading opportunities by identifying key market structures (like FVGs and order blocks) and candlestick patterns. It combines multiple technical analysis concepts into one comprehensive indicator for better decision-making.

Normalized VolumeOVERVIEW
The Normalized Volume (NV) is an attempt at visualizing volume in a format that is more understandable by placing the values on a scale of 0 to 100. 0 in this case is the lowest volume candle available on the chart, and 100 being the highest. Calling a candle “high volume” can be misleading without having something to compare to. For example, in scaling the volume this way we can clearly see that a given candle had 80% of the peak volume or 20%, and gauge the validity of price moves more accurately.
FEATURES
NV by session
Allows user to filter the volume values across 4 different sessions. This can add context to the volume output, because what it high volume during London session may not be high volume relative to New York session.
Overlay plotting
When volume boxes are turned on, this will allow you to toggle how they are plotted.
Color theme
A standard color theme will color the NV based on if the respective candle closed green or red. Selecting variables will color the NV plot based on which range the value falls within.
Session inputs
Activated with the “By session?” Input. Allows user to break the day up into 4 sessions to more accurately gauge volume relative to time of day.
Show Box (X)
Toggles on chart boxes on and off.
Show historical boxes
Will plot prior occurrences of selected volume boxes, deleting them when price fully moves through them in the opposite direction of the initial candle.
Color inputs
Allows for intensive customization in how this tool appears visually.
INTERPRETATION
There are 6 pre-defined ranges that NV can fall within.
NV <= 10
Volume is insignificant
In this range, volume should not be a confirmation in your trading strategy.
NV > 10 and <= 20
Volume is low
In this range, volume should not be a confirmation in your trading strategy.
NV > 20 and <= 40
Volume is fair
In this range, volume should not be the primary confirmation in your trading strategy.
NV > 40 and <= 60
Volume is high
In this range, volume can be the primary confirmation in your trading strategy.
NV > 60 and <= 80
Volume is very high
In this range, volume can be the primary confirmation in your trading strategy.
NV > 80
Volume is extreme
In this range, volume is likely news driven and caution should be taken. High price volatility possible.
To utilize this tool in conjunction with your current strategy, follow the range explanations above section in this section. The higher the NV value, the stronger you can feel about your directional confirmation.
If NV = 100, this means that the highest volume candle occurred up to that point on your selected timeframe. All future data points will be weighed off of this value.
LIMITATIONS
This tool will not load on tickers that do not have volume data, such as VIX.
STRATEGY
The Normalized Volume plot can be used in exactly the same way as you would normally utilize volume in your trading strategy. All we are doing is weighing the volume relative to itself.
Volume boxes can be used as targets to be filled in a similar way to commonly used “fair value gap” strategies. To utilize this strategy, I recommend selecting “Plot to Wicks” in Overlay Plotting and toggling on Show Historical Boxes.
Volume boxes can be used as areas for entry in a similar way to commonly used “order block” strategies. To utilize this strategy, I recommend selecting “Open To Close” in Overlay Plotting.
NOTES
You are able to plot an info label on right side of NV plot using the "Toggle box label" input. When a box is toggled on this label will tell you when the most recent box of that intensity occurred.
This tool is deeply visually customizable, with the ability to adjust line width for plotted boxes, all colors on both box overlays, and all colors on NV panel. Customize it to your liking!
I have a handful of additional features that I plan on adding to this tool in future updates. If there is anything you would like to see added, any bugs you identify, or any strategies you encounter with this tool, I would love to hear from you!
Huge shoutout to @joebaus for assisting in bringing this tool to life, please check out his work here on TradingView!

FVG Reversal Sentinel🔵 FVG Reversal Sentinel – Multi-Timeframe Fair Value Gap Indicator
The FVG Reversal Sentinel is a powerful TradingView indicator designed to help traders identify and track Fair Value Gaps (FVGs) across multiple timeframes, all within a single chart.
This tool allows you to select up to five separate timeframes, ensuring you never miss key market shifts, whether you are scalping, day trading, or swing trading. You can use this indicator in any asset (Cryptos, Futures, Indices, Forex Pairs, etc.).
🔵 - Key Features -
Multi-Timeframe FVG Tracking – Select and display up to five different timeframes on one chart, providing a comprehensive view of market structure.
Customizable Colors – Adjust bullish and bearish FVG colors to match your chart theme for a seamless trading experience.
Enhanced Market Context – Quickly identify key liquidity zones and refine your entries and exits with precision.
Hide the lower timeframes FVGs to get a clear view in a custom timeframe.
Show or hide mitigated FVGs to declutter the chart.
FVGs boxes are going to be displayed only when the candle bar closes
FVGs are going to be mitigated only when the body of the candle closes above or below the FVG area.
No repainting
Whether you're looking to fine-tune your entries or gain a broader market perspective, the FVG Reversal Sentinel indicator ensures you have the tools to stay ahead of price action and capitalize on market inefficiencies.
🔵 - Customization-
You can change the indicator settings as you see fit to achieve the best results for your use case.
TIMEFRAMES
This indicator provides the ability to select up to 5 timeframes. These timeframes are based on the trader's timeframes including any custom timeframes.
Select the desired timeframe from the options list.
Add the label text you would like to show for the selected timeframe.
Check or uncheck the box to display or hide the timeframe from your chart.
FVG SETTINGS
Length of boxes: allows you to select the length of the box that is going to be displayed for the FVGs.
Delete boxes after fill?: allows you to show or hide mitigated FVGs on your chart.
Hide FVGs lower than enabled timeframes?: allows you to show or hide lower timeframe FVGs on your chart. Example - You are in a 15 minutes timeframe chart, if you choose to hide lower timeframe FVGs you will not be able to see 5 minutes FVG defined in your Timeframes Settings, only 15 minutes or higher timeframe FVGs will be displayed on your chart.
BOX VISUALS
Bullish FVG box color: the color and opacity of the box for the bullish FVGs.
Bearish FVG box color: the color and opacity of the box for the bearish FVGs.
LABELS VISUALS
Bullish FVG labels color: the color for bullish labels.
Bearish FVG labels color: the color for bearish labels.
Labels size: the size of the text displayed in the labels.
Labels position: the position of the label inside the FVGs boxes (right, left or center).
BORDER VISUALS
Border width: the width of the border (the thickness).
Bullish FVG border color: the color and the opacity of the bullish box border.
Bearish FVG border color: the color and the opacity of the bearish box border.
🔵 - How to use the indicator -
Just add the indicator in your chart and click in the settings option to customize it.
Make sure you select the desired timeframes and set the colors and opacity for the FVGs boxes.
This indicator can be used in many trading strategies, such as:
SILVER BULLET
iFVG
iFVG RETEST
These strategies are based on the use of FVGs, this tool can help you analyze the market and make the right decision.
🔵 - How was the indicator designed? -
I have spent a lot of time testing other open source indicators from the community. All of these indicators do a great job, but they have a problem, they not only mitigate FVGs when a candle closes above or below the FVG, they also mitigate FVGs when the candle closes exactly to the tick (not above or below the FVG). This is a problem for many strategies that rely on FVGs mitigation.
What makes this indicator different is that it focuses on just mitigating imbalances at the right time for these strategies.
I have taken ideas and some pieces of code from many community indicator developers, such as:
@twingall
@tflab
@marktools
@nacho-fx
@pmk07
... and many other people, to whom I thank for their valuable work and have allowed me to create this tool by making modifications to their source code.
🔵 - Disclaimer -
This tool is intended solely for informational and educational purposes and should not be regarded as financial, investment, or trading advice. It's not designed to predict market movements or offer specific recommendations. Users should be aware that past performance is not indicative of future results and should not rely on any indicator for financial decisions.

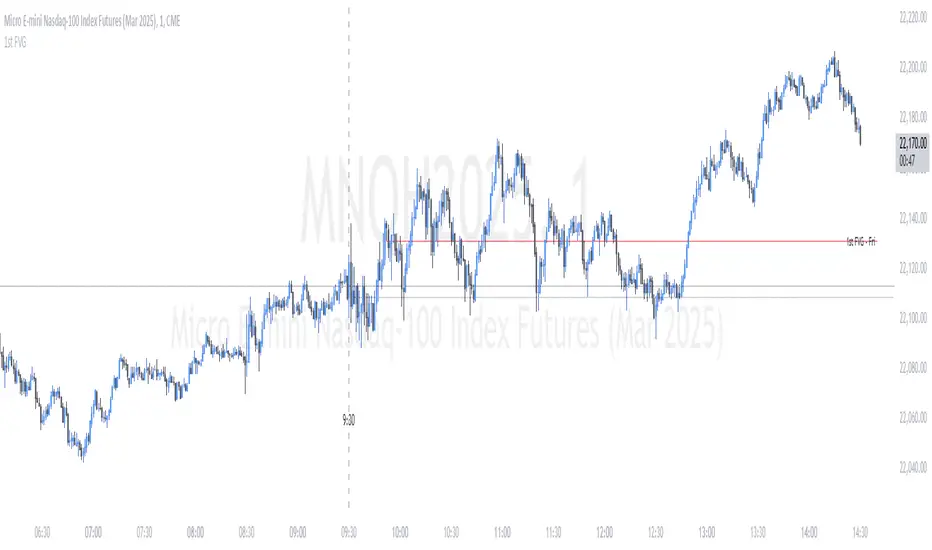
ICT First Presented FVG - NY Open [LuckyAlgo]
This indicator identifies the first Fair Value Gap (FVG) that occurs during the New York trading session, combined with NY session opening price levels. It's an essential tool for traders who follow ICT concepts and focus on the NY trading session.
ICT refers to this as the First Presented FVG, while other traders may call it the 9:30 FVG.
This indicator is best for the 1 minute timeframe, while 5 minute also works.
Detects and marks the first FVG of the NY session
Displays both bullish (green) and bearish (red) FVGs with customizable transparency
Shows the NY session opening price with clear labels
Includes optional vertical line at 9:30 AM NY open
Maintains clean chart visibility with adjustable maximum display days
Includes session date and time labels for easy reference
The indicator helps traders identify potential reversal zones and continuation opportunities by combining two powerful concepts: Fair Value Gaps and NY session opening price. This makes it particularly valuable for day traders and swing traders who want to capitalize on institutional order flow patterns during the most liquid trading session.
You can customize the indicator's appearance, including FVG box colors, time range display, and whether to show the NY open markers. This flexibility allows you to integrate it seamlessly with your existing trading setup.
John Bob-Trading-BotDeveloped by Ayebale John Bob with the help of his bestie, this innovative strategy combines advanced Smart Money Concepts with practical risk management tools to help traders identify and capitalize on key market moves.
Key Features:
Smart Money Concepts & Fair Value Gaps (FVG):
The strategy monitors price action for fair value gaps, which are visualized as extremely faint horizontal lines on the chart. These FVGs signal potential areas where institutional traders might have entered or exited positions.
Dynamic Entry Signals:
Buy signals are triggered when the price crosses above the 50-bar lowest low or when a bullish FVG is detected. Conversely, sell signals are generated when the price falls below the 50-bar highest high or a bearish FVG is identified. Each signal is visually marked on the chart with clear buy (green) and sell (red) labels.
Multi-Level Order Execution:
Once an entry signal occurs, the strategy places five separate orders, each with its own take-profit (TP) level. The TP levels are calculated dynamically using the Average True Range (ATR) and a set of predefined multipliers. This allows traders to scale out of positions as the market moves favorably.
Dynamic Risk Management:
A stop-loss is automatically set at a distance determined by the ATR, ensuring that risk is managed in accordance with current market volatility.
Real-Time Trade Information Table:
In the bottom-right corner of the chart, a trade information table displays essential details about the current trade:
Side: Displays "BUY NOW" (with a dark green background) for long entries or "SELL NOW" (with a dark red background) for short entries.
Entry Price & Stop-Loss: Shows the entry price (highlighted in green) and the corresponding stop-loss level (highlighted in red).
Take-Profit Levels: Lists the five TP levels, each of which turns green once the market price reaches that target.
Timer: A live timer in minutes counts from the moment the current trade trigger started, helping traders track the duration of their active trades.
Visual Progress Bar:
A histogram-style progress bar is plotted on the chart, visually representing the percentage gain (or loss) relative to the entry price.
This strategy was meticulously designed to incorporate both technical analysis and smart risk management, offering a robust trading solution that adapts to changing market conditions. Whether you're a seasoned trader or just starting out, the AyebaleJohnBob Trading Bot equips you with the tools and visual cues needed to make well-informed trading decisions. Enjoy a seamless blend of strategy and style—crafted with passion by Ayebale John Bob and his bestie!

2022 Model ICT Entry Strategy [TradingFinder] One Setup For Life🔵 Introduction
The ICT 2022 model, introduced by Michael Huddleston, is an advanced trading strategy rooted in liquidity and price imbalance, where time and price serve as the core elements. This ICT 2022 trading strategy is an algorithmic approach designed to analyze liquidity and imbalances in the market. It incorporates concepts such as Fair Value Gap (FVG), Liquidity Sweep, and Market Structure Shift (MSS) to help traders identify liquidity movements and structural changes in the market, enabling them to determine optimal entry and exit points for their trades.
This Full ICT Day Trading Model empowers traders to pinpoint the Previous Day High/Low as well as the highs and lows of critical sessions like the London and New York sessions. These levels act as Liquidity Zones, which are frequently swept prior to a market structure shift (MSS) or a retracement to areas such as Optimal Trade Entry (OTE).
Bullish :
Bearish :
🔵 How to Use
The ICT 2022 model is a sophisticated trading strategy that focuses on identifying key liquidity levels and price movements. It operates based on two main principles. In the first phase, the price approaches liquidity zones and sweeps critical levels such as the previous day’s high or low and key session levels.
This movement is known as a Liquidity Sweep. In the second phase, following the sweep, the price retraces to areas like the FVG (Fair Value Gap), creating ideal entry points for trades. Below is a detailed explanation of how to apply this strategy in bullish and bearish setups.
🟣 Bullish ICT 2022 Model Setup
To use the ICT 2022 model in a bullish setup, start by identifying the Previous Day High/Low or key session levels, such as those of the London or New York sessions. In a bullish setup, the price usually moves downward first, sweeping the Liquidity Low. This move, known as a Liquidity Sweep, reflects the collection of buy orders by major market participants.
After the liquidity sweep, the price should shift market structure and start moving upward; this shift, referred to as Market Structure Shift (MSS), signals the beginning of an upward trend. Following MSS, areas like FVG, located within the Discount Zone, are identified. At this stage, the trader waits for the price to retrace to these zones. Once the price returns, a long trade is executed.
Finally, the stop-loss should be set below the liquidity low to manage risk, while the take-profit target is usually placed above the previous day’s high or other identified liquidity levels. This structure enables traders to take advantage of the upward price movement after the liquidity sweep.
🟣 Bearish ICT 2022 Model Setup
To identify a bearish setup in the ICT 2022 model, begin by marking the Previous Day High/Low or key session levels, such as the London or New York sessions. In this scenario, the price typically moves upward first, sweeping the Liquidity High. This move, known as a Liquidity Sweep, signifies the collection of sell orders by key market players.
After the liquidity sweep, the price should shift market structure downward. This movement, called the Market Structure Shift (MSS), indicates the start of a downtrend. Following MSS, areas such as FVG, found within the Premium Zone, are identified. At this stage, the trader waits for the price to retrace to these areas. Once the price revisits these zones, a short trade is executed.
In this setup, the stop-loss should be placed above the liquidity high to control risk, while the take-profit target is typically set below the previous day’s low or another defined liquidity level. This approach allows traders to capitalize on the downward price movement following the liquidity sweep.
🔵 Settings
Swing period : You can set the swing detection period.
Max Swing Back Method : It is in two modes "All" and "Custom". If it is in "All" mode, it will check all swings, and if it is in "Custom" mode, it will check the swings to the extent you determine.
Max Swing Back : You can set the number of swings that will go back for checking.
FVG Length : Default is 120 Bar.
MSS Length : Default is 80 Bar.
FVG Filter : This refines the number of identified FVG areas based on a specified algorithm to focus on higher quality signals and reduce noise.
Types of FVG filters :
Very Aggressive Filter: Adds a condition where, for an upward FVG, the last candle's highest price must exceed the middle candle's highest price, and for a downward FVG, the last candle's lowest price must be lower than the middle candle's lowest price. This minimally filters out FVGs.
Aggressive Filter: Builds on the Very Aggressive mode by ensuring the middle candle is not too small, filtering out more FVGs.
Defensive Filter: Adds criteria regarding the size and structure of the middle candle, requiring it to have a substantial body and specific polarity conditions, filtering out a significant number of FVGs.
Very Defensive Filter: Further refines filtering by ensuring the first and third candles are not small-bodied doji candles, retaining only the highest quality signals.
🔵 Conclusion
The ICT 2022 model is a comprehensive and advanced trading strategy designed around key concepts such as liquidity, price imbalance, and market structure shifts (MSS). By focusing on the sweep of critical levels such as the previous day’s high/low and important trading sessions like London and New York, this strategy enables traders to predict market movements with greater precision.
The use of tools like FVG in this model helps traders fine-tune their entry and exit points and take advantage of bullish and bearish trends after liquidity sweeps. Moreover, combining this strategy with precise timing during key trading sessions allows traders to minimize risk and maximize returns.
In conclusion, the ICT 2022 model emphasizes the importance of time and liquidity, making it a powerful tool for both professional and novice traders. By applying the principles of this model, you can make more informed trading decisions and seize opportunities in financial markets more effectively.

ILD inverse liquidity Divergence StrategyDetermine Bias (Bullish):
H4 chart shows an uptrend with higher highs and higher lows.
Identify a swing high where resting liquidity (buy-side) is likely above.
Look for SMT Divergence (Lower Timeframes):
On M15, EUR/USD makes a higher high while GBP/USD fails to, signaling potential manipulation.
Spot an Inverse Fair Value Gap (IFVG):
Price has impulsively moved up, leaving a fair value gap below.
Wait for a Retracement (Entry):
Price retraces into the IFVG near a Fibonacci 61.8% retracement level.
Enter long here with a SL below the gap.
Set Risk-to-Reward:
SL = 10 pips below the entry.
TP = 20 pips above (1:2 R:R), targeting a resting liquidity zone above a recent swing high.
Monitor and Exit:
Price moves into the liquidity zone, hits TP, and completes the trade.

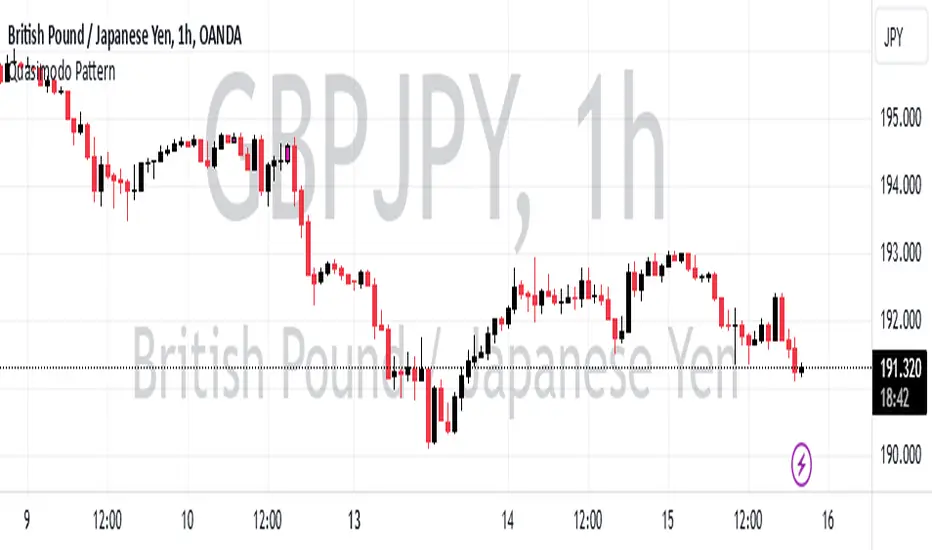
Quasimodo PatternWhat is a Quasimodo Pattern?
A Quasimodo Pattern is a chart pattern traders look for to predict possible price reversals in the market:
- Bullish Quasimodo: Signals a possible price increase (buying opportunity).
- Bearish Quasimodo: Signals a potential price decrease (selling opportunity).
How the Script Works
1. Bullish Quasimodo:
- Checks if the price pattern shows signs of a potential upward movement:
- The current low price is higher than a previous price point (suggesting fair value gap).
- The previous candle closed higher than it opened (bullish candle).
- The candle before that closed lower than it opened (bearish candle).
2. Bearish Quasimodo:
- Looks for signs of a downward movement:
- The current high price is lower than a previous price point (suggesting fair value gap).
- The previous candle closed lower than it opened (bearish candle).
- The candle before that closed higher than it opened (bullish candle).
Visual Indicators
- Yellow Candles: Indicate a bullish Quasimodo pattern.
- Pink Candles: Indicate a bearish Quasimodo pattern.
Alerts
If a Quasimodo pattern is detected, the script sends an alert:
- The alert says: "A Quasimodo Pattern has appeared!"
Purpose
Traders can use this tool to quickly spot potential trend changes without manually analyzing every chart, saving time and improving decision-making for trades.
ICT Judas Swing | Flux Charts💎 GENERAL OVERVIEW
Introducing our new ICT Judas Swing Indicator! This indicator is built around the ICT's "Judas Swing" strategy. The strategy looks for a liquidity grab around NY 9:30 session and a Fair Value Gap for entry confirmation. For more information about the process, check the "HOW DOES IT WORK" section.
Features of the new ICT Judas Swing :
Implementation of ICT's Judas Swing Strategy
2 Different TP / SL Methods
Customizable Execution Settings
Customizable Backtesting Dashboard
Alerts for Buy, Sell, TP & SL Signals
📌 HOW DOES IT WORK ?
The strategy begins by identifying the New York session from 9:30 to 9:45 and marking recent liquidity zones. These liquidity zones are determined by locating high and low pivot points: buyside liquidity zones are identified using high pivots that haven't been invalidated, while sellside liquidity zones are found using low pivots. A break of either buyside or sellside liquidity must occur during the 9:30-9:45 session, which is interpreted as a liquidity grab by smart money. The strategy assumes that after this liquidity grab, the price will reverse and move in the opposite direction. For entry confirmation, a fair value gap (FVG) in the opposite direction of the liquidity grab is required. A buyside liquidity grab calls for a bearish FVG, while a sellside grab requires a bullish FVG. Based on the type of FVG—bullish for buys and bearish for sells—the indicator will then generate a Buy or Sell signal.
After the Buy or Sell signal, the indicator immediately draws the take-profit (TP) and stop-loss (SL) targets. The indicator has three different TP & SL modes, explained in the "Settings" section of this write-up.
You can set up alerts for entry and TP & SL signals, and also check the current performance of the indicator and adjust the settings accordingly to the current ticker using the backtesting dashboard.
🚩 UNIQUENESS
This indicator is an all-in-one suit for the ICT's Judas Swing concept. It's capable of plotting the strategy, giving signals, a backtesting dashboard and alerts feature. Different and customizable algorithm modes will help the trader fine-tune the indicator for the asset they are currently trading. Three different TP / SL modes are available to suit your needs. The backtesting dashboard allows you to see how your settings perform in the current ticker. You can also set up alerts to get informed when the strategy is executable for different tickers.
⚙️ SETTINGS
1. General Configuration
Swing Length -> The swing length for pivot detection. Higher settings will result in
FVG Detection Sensitivity -> You may select between Low, Normal, High or Extreme FVG detection sensitivity. This will essentially determine the size of the spotted FVGs, with lower sensitivies resulting in spotting bigger FVGs, and higher sensitivies resulting in spotting all sizes of FVGs.
2. TP / SL
TP / SL Method ->
a) Dynamic: The TP / SL zones will be auto-determined by the algorithm based on the Average True Range (ATR) of the current ticker.
b) Fixed : You can adjust the exact TP / SL ratios from the settings below.
Dynamic Risk -> The risk you're willing to take if "Dynamic" TP / SL Method is selected. Higher risk usually means a better winrate at the cost of losing more if the strategy fails. This setting is has a crucial effect on the performance of the indicator, as different tickers may have different volatility so the indicator may have increased performance when this setting is correctly adjusted.

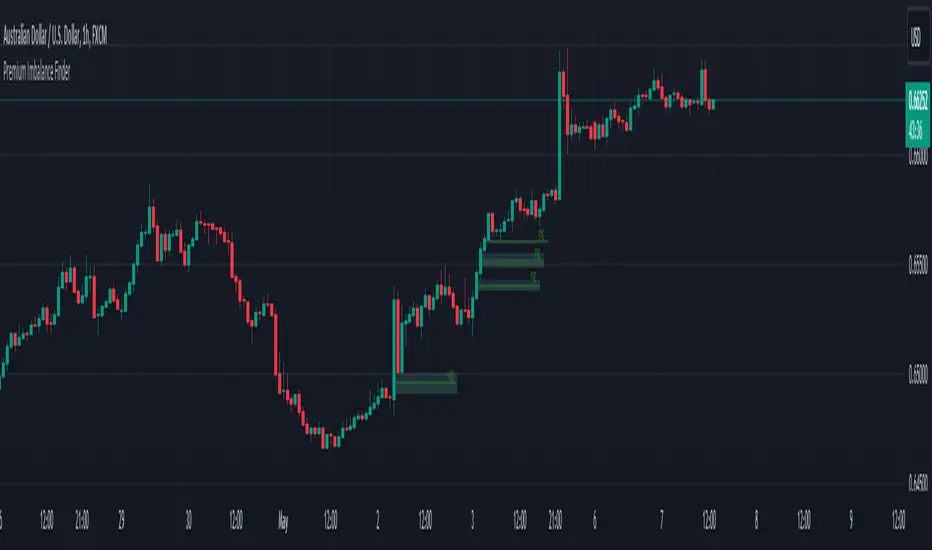
Premium Imbalance FinderIntroducing the Premium Imbalances Indicator, a powerful tool designed help traders identify and analyze market imbalances. This advanced indicator offers a comprehensive suite of features to enhance your trading experience and provide valuable insights into market dynamics.
Key Features:
Fair Value Gap (FVG): Identify price ranges where the market has not achieved fair value, indicating potential imbalances and trading opportunities.
Balanced Price Range (BPR): Visualize price ranges where the market has found a balance between supply and demand.
Volume Imbalance: Detect areas of significant volume imbalance, highlighting the absence of body volume and potential market inefficiencies.
Opening Gap: Identify un-offered price ranges at the opening of a trading session, providing insights into potential market direction.
Customizable Display: Adjust the display limit to control the number of imbalance boxes visible on the chart, ensuring a clutter-free and focused view.
Mitigation Analysis: Set a mitigation level to determine when an imbalance has been mitigated and track the percentage of mitigation for each imbalance.
Higher Timeframe Analysis: Enable the HTF Imbalance feature to analyze imbalances on higher timeframes, providing a broader perspective on market structure.
Customizable Appearance: Personalize the colors of imbalance boxes, premium zones, and mid-lines to suit your visual preferences and easily distinguish between bullish and bearish imbalances.
Flexible Imbalance Extension: Choose between custom, current, or extended imbalance box display to adapt to your trading style and analysis requirements.
Detailed Tooltips: Hover over imbalance labels to view the percentage of mitigation for each imbalance, providing quick and easy access to crucial information.
The Premium Imbalances Indicator is suitable for traders of all levels, from beginners to experienced professionals, and can be used across various markets and timeframes.
By utilizing this powerful tool, traders can gain a deeper understanding of market dynamics, identify potential trading opportunities, and make more informed decisions based on the analysis of imbalances. The indicator's customizable features and detailed insights make it an essential addition to any trader's toolkit.
HTF FVG and Wick Fill trackingImbalances in the charts are some of the clearest and most traded price areas. Two of the best and most used are fair value gaps FVGs and large candle wicks. In both of these price appears to move in such a way that most are left behind having 'missed' the move. But in reality price will often come back to these price points to re-balance and absorb the liquidity that was left behind.
This indicator takes these areas and makes viewing and tracking them clearer than ever. It does this, by first allowing the user to overlay a higher timeframe candle on the current chart. This in itself provides an in depth look at a higher timeframe candle both as it forms and in its final form.
Next the indicator identifies either the FVG or large wicks, on the chosen higher timeframe, all while the chart remains on a lower timeframe. As seen here the fair value gaps are clearly highlighted, taken from a 4 hour timeframe, while the actual chart is on 15 minutes. This allows the user even greater accuracy in identifying their key trading areas.
Utilizing the indicators unique feature, these areas can optionally be extended forward to the current timeframe and 'filled' in realtime. Areas that are filled to the users defined level, will be removed from the chart.
With supplementary settings for how much history to show, how large of a wick should be highlighted and complete control over the colour scheme, users will be able to track and understand the filling of imbalances like never before.

ICT Silver Bullet [LuxAlgo]The ICT Silver Bullet indicator is inspired from the lectures of "The Inner Circle Trader" (ICT) and highlights the Silver Bullet (SB) window which is a specific 1-hour interval where a Fair Value Gap (FVG) pattern can be formed.
When a FVG is formed during the Silver Bullet window, Support & Resistance lines will be drawn at the end of the SB session.
There are 3 different Silver Bullet windows (New York local time):
The London Open Silver Bullet (3 AM — 4 AM ~ 03:00 — 04:00)
The AM Session Silver Bullet (10 AM — 11 AM ~ 10:00 — 11:00)
The PM Session Silver Bullet (2 PM — 3 PM ~ 14:00 — 15:00)
🔶 USAGE
The ICT Silver Bullet indicator aims to provide users a comprehensive display as similar as possible to how anyone would manually draw the concept on their charts.
It's important to use anything below the 15-minute timeframe to ensure proper setups can display. In this section, we are purely using the 3-minute timeframe.
In the image below, we can see a bullish setup whereas a FVG was successfully retested during the Silver Bullet session. This was then followed by a move upwards to liquidity as our target.
Alternatively, you can also see below a bearish setup utilizing the ICT Silver Bullet indicator outlined.
At this moment, the indicator has removed all other FVGs within the Silver Bullet session & has confirmed this FVG as the retested one.
There is also a support level marked below to be used as a liquidity target as per the ICT Silver Bullet concept suggests.
In the below chart we can see 4 separate consecutive examples of bullish & bearish setups on the 3-minute chart.
🔶 CONCEPTS
This technique can visualize potential support/resistance lines, which can be used as targets.
The script contains 2 main components:
• forming of a Fair Value Gap (FVG)
• drawing support/resistance (S/R) lines
🔹 Forming of FVG
1 basic principle: when a FVG at the end of the SB session is not retraced, it will be made invisible.
Dependable on the settings, different FVG's will be shown.
• 'All FVG': all FVG's are shown, regardless the trend
• 'Only FVG's in the same direction of trend': Only FVG's are shown that are similar to the trend at that moment (trend can be visualized by enabling ' Show ' -> ' Trend ')
-> only bearish FVG when the trend is bearish vs. bullish FVG when trend is bullish
• 'strict': Besides being similar to the trend, only FVG's are shown when the closing price at the end of the SB session is:
– below the top of the FVG box (bearish FVG)
– above bottom of the FVG box (bullish FVG)
• 'super-strict': Besides being similar to the trend, only FVG's are shown when the FVG box is NOT broken
in the opposite direction AND the closing price at the end of the SB session is:
– below bottom of the FVG box (bearish FVG)
– above the top of the FVG box (bullish FVG)
' Super-Strict ' mode resembles ICT lectures the most.
🔹 Drawing support/resistance lines
When the SB session has ended, the script draws potential support/resistance lines, again, dependable on the settings.
• Previous session (any): S/R lines are fetched between current and previous session.
For example, when current session is ' AM SB Session (10 AM — 11 AM) ', then previous session is
' London Open SB (3 AM — 4 AM) ', S/R lines between these 2 sessions alone will be included.
• Previous session (similar): S/R lines are fetched between current and previous - similar - session.
For example, when current session is ' London Open SB (3 AM — 4 AM)' , only S/R lines between
current session and previous ' London Open SB (3 AM — 4 AM) ' session are included.
When a new session starts, S/R lines will be removed, except when enabling ' Keep lines (only in strict mode) '
This is not possible in ' All FVG ' or ' Only FVG's in the same direction of trend ' mode, since the chart would be cluttered.
Note that in ' All FVG ' or ' Only FVG's in the same direction of trend ' mode, both, Support/Resistance lines will be shown,
while in Strict/Super-Strict mode:
• only Support lines will be shown if a bearish FVG appears
• only Resistance lines if a bullish FVG is shown
The lines will still be drawn the the end of the SB session, when a valid FVG appears,
but the S/R lines will remain visible and keep being updated until price reaches that line.
This publication contains a "Minimum Trade Framework (mTFW)", which represents the best-case expected price delivery, this is not your actual trade entry - exit range.
• 40 ticks for index futures or indices
• 15 pips for Forex pairs.
When on ' Strict/Super-Strict ' mode, only S/R lines will be shown which are:
• higher than the lowest FVG bottom + mTFW, in a bullish scenario
• lower than the highest FVG bottom - mTFW, in a bearish scenario
When on ' All FVG/Only FVG's in the same direction of trend ' mode, or on non-Forex/Futures/Indices symbols, S/R needs to be higher/lower than SB session high/low.
🔶 SETTINGS
(Check CONCEPTS for deeper insights and explanation)
🔹 Swing settings (left): Sets the length, which will set the lookback period/sensitivity of the Zigzag patterns (which directs the trend)
🔹 Silver Bullet Session; Show SB session: show lines and labels of SB session
Labels can be disabled separately in the ' Style ' section, color is set at the ' Inputs ' section.
🔹 FVG
– Mode
• All FVG
• Only FVG's in the same direction of trend
• Strict
• Super-Strict
– Colors
– Extend: extend till last bar of SB session
🔹 Targets – support/resistance lines
– Previous session (any): S/R lines fetched between current and previous SB session
– Previous session (similar): S/R lines fetched between current and previous similar SB session
– Colors
– Keep lines (only in strict mode)
🔹 Show
– MSS ~ Session: Show Market Structure Shift , only when this happens during a SB session
– Trend: Show trend (Zigzag, colored ~ trend)

Liquidity Engulfing & Displacement [MsF]Japanese below / 日本語説明は英文の後にあります。
-------------------------
*This indicator is based on upslidedown's "Liquidity Engulfing Candles ". It's a very cool indicator. thank you.
It has 2 functions: show the Liquidity Engulfing on HTF and candle color change when displacement occurs.
=== Function description ===
1. Liquidity Engulfing on HTF
This indicator gives Liquidity Engulfing signals not only for the current candle, but also for H4 and H1 on HTF.
You can use that a bullish engulfing on H1 is a BOS on m5 and on H4 is a BOS on m15. It uses the theory of stop hunt from ICT.
Also, It's possible to fire alert.
2. Displacement
Change the color display of the candlesticks when a bullish candleStick or bearish candleStick is attached. Furthermore, by enabling the "Require FVG" option, you can easily discover the FVG (Fair Value Gap). It is a very useful function for ICT trading.
When H1 candle takes liquidity from one side and moves with an explosive move to the other side of the previous candle (displacement), it creates break of market structure on M5. Entry on discount FVG or OTE with stop loss at or below the stop hunt wick.
=== Parameter description ===
- Liquidity engulfing candles(LEC) SETTING
- Show H1 LEC … Whether to show LEC for H1
- Show H4 LEC … Whether to show LEC for H4
- Show Current LEC … Whether to show LEC for current timeframe
- Apply Stop Hunt Wick Filter … Require candle wick into prior candle retracement zone
- Apply Close Filter … Require LL/HH on candle in order to print a valid engulfing signal
- DISPLACEMENT SETTING
- Require FVG … Draw only when FVG occurs
- Displacement Type … Displacement from open to close? or from high to low?
- Displacement Length … Period over which to calculate the standard deviation
- Displacement Strength … The larger the number, the stronger the displacement detected
-------------------------
2つの機能があります: 上位足のLiquidity engulfing(流動性獲得)を表示することと、大きな変位が発生したときにローソク足の色を変更することです。
=== 機能説明 ===
1. 上位足のLiquidity engulfing
このインジケーターは、現在のローソク足だけでなく、上位足の H4 および H1 に対してもLiquidity engulfingシグナルを提供します。
H1はm5、H4はm15での使用を推奨します。これはICTのストップハント理論を活用しています。また、アラートを発することも可能です。
2. 変位(DISPLACEMENT)
大きな陽線、陰線を付けた場合に、そのローソク足をカラー表示を変更します。
さらに"Require FVG"オプションを有効にすることで、FVG(Fair Value Gap)を容易に発見することができます。ICTトレードにを行うにあたり大変有用な機能となっています。
=== パラメータの説明 ===
- Liquidity engulfing candles(LEC) SETTING
- Show H1 LEC … H1のLECを表示するかどうか
- Show H4 LEC … H4のLECを表示するかどうか
- Show Current LEC … 現在の期間の LEC を表示するかどうか
- Apply Stop Hunt Wick Filter … ハラミ足、もしくは包み足になっている場合のみに検知させる
- Apply Close Filter … 1つ前のローソクよりも終値で超えていた場合のみに検知させる
- DISPLACEMENT SETTING
- Require FVG … FVG発生時のみ描画する
- Displacement Type … openからcloseまでの変位か?highからlowまでの変位か?
- Displacement Length … 標準偏差を計算する期間
- Displacement Strength … 変位の強さ(数字が大きいほど強い変位を検出)

ICT HTF Liquidity Levels /w Alert [MsF]Japanese below / 日本語説明は英文の後にあります。
-------------------------
*This indicator is based on sbtnc's "HTF Liquidity Levels". It's a very cool indicator. thank you.
It has 3 functions: visualization of HTF liquidity (with alert), candle color change when displacement occurs, and MSB (market structure break) line display.
=== Function description ===
1. HTF liquidity (with alert)
Lines visualize the liquidity pools on the HTF bars. Alerts can be set for each TF's line.
Once the price reaches the line, the line is repaint.
To put it plainly, the old line disappears and a new line appears. The line that disappeared remains as a purged line. (It is also possible to hide the purged line with a parameter)
The alert will be triggered at the moment the line disappears. An alert will be issued when you touch the HTF's liquid pools where the loss is accumulated, so you can notice the stop hunting with the alert.
This alert is an original feature of this indicator.
The timeframe of the HTF can't modify. You can get Monthly, weekly, daily and H1 and H4.
Each timeframe displays the 3 most recent lines. By narrowing it down to 3, it is devised to make it easier to see visually. (This indicator original)
2. Displacement
Change the color display of the candlesticks when a bullish candle stick or bearish candle stick is attached. Furthermore, by enabling the "Require FVG" option, you can easily discover the FVG (Fair Value Gap). It is a very useful function for ICT trading.
3. MSB (market structure break)
Displays High/Low lines for the period specified by the parameter. It is useful for discovering BoS & CHoCH/MSS, which are important in ICT trading.
=== Parameter description ===
- HTF LIQUIDITY
- Daily … Daily line display settings (color, line width)
- Weekly … Weekly line display settings (color, line width)
- Monthly … Monthly line display settings (color, line width)
- INTRADAY LIQUIDITY
- 1H … 1H line display settings (color, line width)
- 4H … 4H line display settings (color, line width)
- PURGED LIQUIDITY … Display setting of the line once the candle reaches
- Show Purge Daily … Daily purged line display/non-display setting
- Show Purge Weekly … Weekly purged line display/non-display setting
- Show Purge Monthly … Monthly purged line display/non-display setting
- Show Purge 1H … 1H purged line display/non-display setting
- Show Purge 4H … 4H purged line display/non-display setting
- MARKET STRUCTURE BREAK - MBS
- Loopback … Period for searching High/Low
- DISPLACEMENT FOR FVG
- Require FVG … Draw only when FVG occurs
- Displacement Type … Displacement from open to close? or from high to low?
- Displacement Length … Period over which to calculate the standard deviation
- Displacement Strength … The larger the number, the stronger the displacement detected
-------------------------
このインジケータはsbtncさんの"HTF Liquidity Levels"をベースに作成しています。
上位足流動性の可視化(アラート付き)、変位発生時のローソク色変更、MSB(market structure break)ライン表示の3つの機能を有します。
<機能説明>
■上位足流動性の可視化
上位足の流動性の吹き溜まり(ストップが溜まっているところ)をラインで可視化します。ラインにはアラートを設定することが可能です。
一度価格がラインに到達するとそのラインは再描画されます。
平たく言うと、今までのラインが消えて新しいラインが出現する。という事です。
消えたラインはpurgeラインとして残ります。(パラメータでpurgeラインを非表示にすることも可能です)
アラートはラインが消える瞬間に発報します。上位足の損切り溜まってるところにタッチするとアラートを発報するので、アラートにてストップ狩りに気づくことができます。
このアラート発報については本インジケータオリジナルの機能となります。
表示可能な上位足のタイムフレームは固定です。月足、週足、日足およびH1とH4を表示することができます。
各タイムフレーム、直近から3つのラインを表示します。3つに絞ることで視覚的に見やすく工夫しています。(本インジケータオリジナル)
■変位発生時のローソク色変更
大きな陽線、陰線を付けた場合に、そのローソク足をカラー表示を変更します。
さらに"Require FVG"オプションを有効にすることで、FVG(Fair Value Gap)を容易に発見することができます。ICTトレードにを行うにあたり大変有用な機能となっています。
■MSB(market structure break)ライン表示
パラメータで指定した期間のHigh/Lowをライン表示します。ICTトレードで重要視しているBoS & CHoCH/MSSの発見に役立ちます。
<パラメータ説明>
- HTF LIQUIDITY
- Daily … 日足ライン表示設定(色、線幅)
- Weekly … 週足ライン表示設定(色、線幅)
- Monthly … 月足ライン表示設定(色、線幅)
- INTRADAY LIQUIDITY
- 1H … 1時間足ライン表示設定(色、線幅)
- 4H … 4時間足ライン表示設定(色、線幅)
- PURGED LIQUIDITY … 一度到達したラインの表示設定
- Show Purge Daily … 日足ライン表示/非表示設定
- Show Purge Weekly … 週足ライン表示/非表示設定
- Show Purge Monthly … 月足ライン表示/非表示設定
- Show Purge 1H … 1時間足ライン表示/非表示設定
- Show Purge 4H … 4時間足ライン表示/非表示設定
- MARKET STRUCTURE BREAK - MBS
- Loopback … High/Lowを探索する期間
- DISPLACEMENT FOR FVG
- Require FVG … FVG発生時のみ描画する
- Displacement Type … openからcloseまでの変位か?highからlowまでの変位か?
- Displacement Length … 標準偏差を計算する期間
- Displacement Strength … 変位の強さ(数字が大きいほど強い変位を検出)

MirPapa_Lib_BoxLibrary "MirPapa_Lib_Box"
GetHTFrevised(_tf, _case)
GetHTFrevised
@description Retrieve a specific bar value from a Higher Time Frame (HTF) series.
Parameters:
_tf (string) : string The target HTF string (examples: "60", "1D").
_case (string) : string Case string determining which OHLC value to request.
@return float Returns the requested HTF value or na if _case does not match.
GetHTFrevised(_tf)
Parameters:
_tf (string)
GetHTFoffsetToLTFoffset(_offset, _chartTf, _htfTf)
GetHTFoffsetToLTFoffset
@description Adjust an HTF offset to an LTF offset by calculating the ratio of timeframes.
Parameters:
_offset (int) : int The HTF bar offset (0 means current HTF bar).
_chartTf (string) : string The current chart's timeframe (e.g., "5", "15", "1D").
_htfTf (string) : string The High Time Frame string (e.g., "60", "1D").
@return int The corresponding LTF bar index. Returns 0 if the result is negative.
GetHtfFromLabel(_label)
GetHtfFromLabel
@description Convert a Korean HTF label into a Pine Script timeframe string.
Parameters:
_label (string) : string The Korean label (e.g., "5분", "1시간").
@return string Returns the corresponding Pine Script timeframe (e.g., "5", "60").
IsChartTFcomparisonHTF(_chartTf, _htfTf)
IsChartTFcomparisonHTF
@description Determine whether a given HTF is greater than or equal to the current chart timeframe.
Parameters:
_chartTf (string) : string Current chart timeframe (e.g., "5", "15", "1D").
_htfTf (string) : string HTF timeframe (e.g., "60", "1D").
@return bool True if HTF ≥ chartTF, false otherwise.
IsCondition(_boxType, _isBull, _pricePrev, _priceNow)
IsCondition
@description FOB, FVG 조건 체크.\
_boxType: "fob"(Fair Order Block) 또는 "fvg"(Fair Value Gap).\
_isBull: true(상승 패턴), false(하락 패턴).\
상승 시 현재 가격이 이전 가격보다 높으면 true, 하락 시 이전 가격이 현재 가격보다 높으면 true 반환.
Parameters:
_boxType (string) : 박스 타입 ("fob", "fvg")
_isBull (bool) : 상승(true) 또는 하락(false)
_pricePrev (float) : 이전 가격
_priceNow (float) : 현재 가격
Returns: bool 조건 만족 여부
IsCondition(_boxType, _high2, _high1, _high0, _low2, _low1, _low0)
IsCondition
@description Sweep 조건 체크 (Swing High/Low 동시 발생).\
_boxType: "sweep" 또는 "breachBoth".\
조건: high2 < high1 > high0 (Swing High) AND low2 > low1 < low0 (Swing Low).\
중간 캔들이 양쪽보다 높고 낮은 지점을 동시에 형성할 때 true 반환.
Parameters:
_boxType (string) : 박스 타입 ("sweep", "breachBoth")
_high2 (float)
_high1 (float)
_high0 (float)
_low2 (float)
_low1 (float)
_low0 (float)
Returns: bool 조건 만족 여부
IsCondition(_boxType, _isBull, _open1, _close1, _high1, _low1, _open0, _close0, _low2, _low3, _high2, _high3)
IsCondition
@description RB (Rejection Block) 조건 체크.\
_boxType: "rb" (Rejection Block).\
상승 RB: candle1=음봉, candle0=양봉, low3>low1 AND low2>low1, close1*1.001>open0, open1close0.\
이전 캔들의 거부 후 현재 캔들이 반대 방향으로 전환될 때 true 반환.
Parameters:
_boxType (string) : 박스 타입 ("rb")
_isBull (bool) : 상승(true) 또는 하락(false)
_open1 (float)
_close1 (float)
_high1 (float)
_low1 (float)
_open0 (float)
_close0 (float)
_low2 (float)
_low3 (float)
_high2 (float)
_high3 (float)
Returns: bool 조건 만족 여부
IsCondition(_boxType, _isBull, _open2, _close1, _open1, _close0)
IsCondition
@description SOB (Strong Order Block) 조건 체크.\
_boxType: "sob" (Strong Order Block).\
상승 SOB: 양봉2 => 음봉1 => 양봉0, open2 > close1 AND open1 < close0.\
하락 SOB: 음봉2 => 양봉1 => 음봉0, open2 < close1 AND open1 > close0.\
3개 캔들 패턴으로 강한 주문 블록 형성 시 true 반환.
Parameters:
_boxType (string) : 박스 타입 ("sob")
_isBull (bool) : 상승(true) 또는 하락(false)
_open2 (float) : 2개 이전 캔들 open
_close1 (float) : 1개 이전 캔들 close
_open1 (float) : 1개 이전 캔들 open
_close0 (float) : 현재 캔들 close
Returns: bool 조건 만족 여부
CreateBox(_boxType, _tf, _isBull, _useLine, _colorBG, _colorBD, _colorText, _cache)
CreateBox
@description 박스 생성 (breachMode 자동 결정).\
_boxType: "fob", "rb", "custom" → directionalHighLow, 나머지 → both.\
_tf: 시간대 (timeframe.period 또는 HTF).\
_isBull: true(상승 박스), false(하락 박스).\
_cache: HTF 사용 시 필수, CurrentTF는 na.\
반환: .
Parameters:
_boxType (string) : 박스 타입
_tf (string) : 시간대
_isBull (bool) : 상승(true) 또는 하락(false)
_useLine (bool) : 중간선 표시 여부
_colorBG (color) : 박스 배경색
_colorBD (color) : 박스 테두리색
_colorText (color) : 텍스트 색상
_cache (HTFCache) : HTF 캐시 데이터
Returns: 성공 여부와 박스 데이터
CreateBox(_boxType, _tf, _isBull, _useLine, _colorBG, _colorBD, _colorText, _cache, _customText)
CreateBox
@description 박스 생성 (커스텀 텍스트 지원, breachMode 자동 결정).\
_boxType: "fob", "rb", "custom" → directionalHighLow, 나머지 → both.\
_customText: 박스에 표시할 텍스트 (비어있으면 "시간대 박스타입" 형식으로 자동 생성).\
_isBull: true(상승 박스), false(하락 박스).\
반환: .
Parameters:
_boxType (string) : 박스 타입
_tf (string) : 시간대
_isBull (bool) : 상승(true) 또는 하락(false)
_useLine (bool) : 중간선 표시 여부
_colorBG (color) : 박스 배경색
_colorBD (color) : 박스 테두리색
_colorText (color) : 텍스트 색상
_cache (HTFCache) : HTF 캐시 데이터
_customText (string) : 커스텀 텍스트
Returns: 성공 여부와 박스 데이터
CreateBox(_boxType, _breachMode, _tf, _isBull, _useLine, _colorBG, _colorBD, _colorText, _cache, _customText)
CreateBox
@description 박스 생성 (breachMode 명시적 지정).\
_breachMode: "both"(양쪽 모두 돌파), "directionalHighLow"(방향성 high/low 돌파), "directionalClose"(방향성 close 돌파).\
_isBull: true(상승 박스), false(하락 박스).\
_customText: 박스에 표시할 텍스트 (비어있으면 "시간대 박스타입" 형식으로 자동 생성).\
반환: .
Parameters:
_boxType (string) : 박스 타입 (fob, fvg, sweep, rb, custom 등)
_breachMode (string) : 돌파 처리 방식: "both" (양쪽 모두), "directionalHighLow" (방향성 high/low), "directionalClose" (방향성 close)
_tf (string) : 시간대
_isBull (bool) : 상승(true) 또는 하락(false) 방향
_useLine (bool) : 중간선 표시 여부
_colorBG (color) : 박스 배경색
_colorBD (color) : 박스 테두리색
_colorText (color) : 텍스트 색상
_cache (HTFCache) : HTF 캐시 데이터 (CurrentTF는 na)
_customText (string) : 커스텀 텍스트 (비어있으면 자동 생성)
Returns: 성공 여부와 박스 데이터
CreateCustomBox(_boxType, _breachMode, _isBull, _top, _bottom, _left, _right, _useLine, _colorBG, _colorBD, _colorText, _text)
CreateCustomBox
@description 완전히 유연한 커스텀 박스 생성.\
사용자가 박스 위치(top, bottom, left, right), breach mode, 모든 파라미터를 직접 지정.\
조건 체크는 사용자 스크립트에서 수행하고, 이 함수는 박스 생성만 담당.\
새로운 박스 타입 추가 시 라이브러리 수정 없이 사용 가능.
Parameters:
_boxType (string) : 박스 타입 (사용자 정의 문자열)
_breachMode (string) : 돌파 처리 방식: "both", "directionalHighLow", "directionalClose", "sobClose"
_isBull (bool) : 상승(true) 또는 하락(false) 방향
_top (float) : 박스 상단 가격
_bottom (float) : 박스 하단 가격
_left (int) : 박스 시작 시간 (xloc.bar_time 사용)
_right (int) : 박스 종료 시간 (xloc.bar_time 사용)
_useLine (bool) : 중간선 표시 여부
_colorBG (color) : 박스 배경색
_colorBD (color) : 박스 테두리색
_colorText (color) : 텍스트 색상
_text (string) : 박스에 표시할 텍스트
Returns: 성공 여부와 박스 데이터
ProcessBoxDatas(_openBoxes, _closedBoxes, _useMidLine, _closeCount, _colorClose, _currentBarIndex, _currentLow, _currentHigh, _currentTime)
ProcessBoxDatas
@description 박스 확장 및 돌파 처리.\
열린 박스들을 현재 bar까지 확장하고, 돌파 조건 체크.\
_closeCount: 돌파 횟수 (이 횟수만큼 돌파 시 박스 종료).\
breachMode에 따라 돌파 체크 방식 다름 (both/directionalHighLow/directionalClose).\
종료된 박스는 _closedBoxes로 이동하고 _colorClose 색상 적용.\
barstate.islast와 barstate.isconfirmed에서 호출 권장.
Parameters:
_openBoxes (array) : 열린 박스 배열
_closedBoxes (array) : 닫힌 박스 배열
_useMidLine (bool) : 중간선 표시 여부
_closeCount (int) : 돌파 카운트 (이 횟수만큼 돌파 시 종료)
_colorClose (color) : 종료된 박스 색상
_currentBarIndex (int) : 현재 bar_index
_currentLow (float) : 현재 low
_currentHigh (float) : 현재 high
_currentTime (int) : 현재 time
Returns: bool 항상 true
UpdateHTFCache(_cache, _tf)
UpdateHTFCache
@description HTF 데이터 캐싱 (성능 최적화).\
HTF의 OHLC 데이터를 캐싱하여 매 틱마다 request.security 호출 방지.\
_cache: 기존 캐시 (없으면 na, 첫 호출 시).\
_tf: 캐싱할 시간대 (예: "60", "1D").\
새 bar 또는 bar_index 변경 시에만 업데이트, 그 외에는 기존 캐시 반환.\
Parameters:
_cache (HTFCache) : 기존 캐시 데이터 (없으면 na)
_tf (string) : 시간대
Returns: HTFCache 업데이트된 캐시 데이터
GetTimeframeSettings(_currentTF, _midTF1m, _highTF1m, _midTF5m, _highTF5m, _midTF15m, _highTF15m, _midTF30m, _highTF30m, _midTF60m, _highTF60m, _midTF240m, _highTF240m, _midTF1D, _highTF1D, _midTF1W, _highTF1W, _midTF1M, _highTF1M)
GetTimeframeSettings
@description 현재 차트 시간대에 맞는 중위/상위 시간대 자동 선택.\
_currentTF: 현재 차트 시간대 (timeframe.period).\
1분~1월 차트별로 적절한 중위/상위 시간대 매핑.\
예: 5분 차트 → 중위 15분, 상위 60분.\
반환: .\
Parameters:
_currentTF (string) : 현재 차트 시간대
_midTF1m (string)
_highTF1m (string)
_midTF5m (string)
_highTF5m (string)
_midTF15m (string)
_highTF15m (string)
_midTF30m (string)
_highTF30m (string)
_midTF60m (string)
_highTF60m (string)
_midTF240m (string)
_highTF240m (string)
_midTF1D (string)
_highTF1D (string)
_midTF1W (string)
_highTF1W (string)
_midTF1M (string)
_highTF1M (string)
Returns:
BoxData
BoxData
Fields:
_type (series string) : 박스 타입 (fob, fvg, sweep, rb, custom 등)
_breachMode (series string) : 돌파 처리 방식
_isBull (series bool) : 상승(true) 또는 하락(false) 방향
_box (series box)
_line (series line)
_boxTop (series float)
_boxBot (series float)
_boxMid (series float)
_topBreached (series bool)
_bottomBreached (series bool)
_breakCount (series int)
_createdBar (series int)
HTFCache
Fields:
_timeframe (series string)
_lastBarIndex (series int)
_isNewBar (series bool)
_barIndex (series int)
_open (series float)
_high (series float)
_low (series float)
_close (series float)
_open1 (series float)
_close1 (series float)
_high1 (series float)
_low1 (series float)
_open2 (series float)
_close2 (series float)
_high2 (series float)
_low2 (series float)
_high3 (series float)
_low3 (series float)
_time1 (series int)
_time2 (series int)

Smart money PSP with color themesPSP with Color Themes — Price Strength Parity Indicator
PSP with Color Themes is a visual correlation indicator designed to detect Price Strength Parity (PSP) between the current chart symbol and a reference symbol.
It highlights candles where price behavior between two correlated instruments diverges or aligns, which is often used in SMT (Smart Money Technique) and intermarket analysis.
The indicator works directly on the chart and colors candles when a PSP condition is detected, using flexible and customizable color themes.
📌 What Is PSP (Price Strength Parity)?
PSP identifies situations where two correlated assets:
Move in opposite directions → Direct PSP (classic SMT divergence)
Move in the same direction → Inverse PSP (confirmation mode)
Such behavior often precedes:
Reversals
Continuations
Liquidity grabs
Market structure shifts
⚙️ Indicator Inputs
Reference Symbol
Defines the second asset used for comparison (e.g., ETHUSDT vs BTCUSDT).
Purpose:
To detect relative strength or weakness between two correlated markets.
Inverse Correlation Mode
Inverse Correlation Mode (true / false)
Allows switching between divergence-based and confirmation-based analysis.
Color Theme
Available presets:
Green / Red
Blue / Orange
Purple / Yellow
Teal / Pink
Custom
Purpose:
Adapts the indicator visually to different chart styles and backgrounds.
📈 How to Use in Trading
Typical use cases:
SMT divergence detection
Intermarket confirmation
Reversal timing
Liquidity sweep context
SMC / ICT models
Recommended combinations:
Market Structure (BOS / CHoCH)
Fair Value Gaps
Liquidity levels
Session highs /lows
⚠️ Important Notes
PSP is context-based, not a standalone entry system
Best results on correlated markets:
BTC / ETH
Indices (ES / NQ / YM)
FX pairs (EURUSD / DXY)

Smart Gap Concepts [MarkitTick]💡 This indicator automates the identification and classification of price gaps, commonly known as Fair Value Gaps (FVG) or Imbalances, by integrating market structure and volume analysis. Unlike standard gap detectors that simply highlight empty space on a chart, this script applies algorithmic filters to categorize gaps into three distinct phases of market movement: Breakaway, Runaway, and Exhaustion. This helps traders understand the potential context of a move rather than just seeing a support or resistance zone.
● Originality and Utility
The primary innovation of this tool is its dynamic classification system. It moves beyond visual detection by checking the "why" behind the gap. By referencing Swing Highs and Swing Lows (Market Structure) alongside Volume efficiency, it determines if a gap represents a breakout, a trend continuation, or a climatic end to a move. Additionally, the script features an automated mitigation tracking system that removes gaps from the chart once price has re-tested the midpoint, ensuring the visual workspace remains clean and relevant to current price action.
● Methodology
The script operates on a multi-stage logic engine:
• Gap Detection
It first identifies the core imbalance where the Low of the current bar does not overlap with the High of the bar two periods prior (for bullish gaps), ensuring the intervening candle represents a strong displacement.
• Structural Analysis (Breakaway Gaps)
The script monitors Pivot Highs and Lows. If a gap occurs simultaneously with a close beyond a key structural Pivot, it is classified as a "Breakaway Gap." This signals the potential start of a new trend.
• Volume and Time Analysis (Exhaustion Gaps)
To identify potential reversals, the script looks for "Trend Maturity." If a gap forms after a long duration since the last pivot and is accompanied by a volume spike (defined by the Volume Spike Multiplier), it is labeled as an "Exhaustion Gap."
• Continuation (Runaway Gaps)
If a gap is valid but meets neither the Breakaway nor Exhaustion criteria, it is considered a "Runaway Gap," typically found in the middle of an established trend.
• Dynamic Cleanup
The script tracks the midpoint of every active gap. If price creates a lower low (for bullish gaps) or higher high (for bearish gaps) beyond this midpoint, the gap is considered mitigated and is removed from the screen.
📖 How to Use
Traders can utilize the color-coded classifications to gauge market intent:
Breakaway (Default Blue): Watch these zones for potential trend initiations. These are often high-probability areas for a retest entry after a structure break.
Runaway (Default Orange): These indicate strong momentum. They can be used to trail stop-losses or add to winning positions, as price should ideally not close below these gaps in a healthy trend.
Exhaustion (Default Red): Be cautious when these appear. They suggest the current move is overextended and a reversal or complex pullback may be imminent.
• Exhaustion Gap : A Practical Case Study
• Breakaway Gap: A Practical Case Study
• Runaway Gap : A Practical Case Study
⚙️ Inputs and Settings
Min Gap Size (Points): Filters out insignificant gaps smaller than this threshold.
Structure Lookback: Defines the sensitivity of the Pivot detection (Swing High/Low).
Volume Avg Length & Multiplier: Determines what qualifies as a "Volume Spike" for exhaustion logic.
Trend Maturity: The minimum number of bars required to consider a trend "old" enough for an exhaustion signal.
Visual Settings: Custom colors for each gap type and box extension length.
● Disclaimer
All provided scripts and indicators are strictly for educational exploration and must not be interpreted as financial advice or a recommendation to execute trades. I expressly disclaim all liability for any financial losses or damages that may result, directly or indirectly, from the reliance on or application of these tools. Market participation carries inherent risk where past performance never guarantees future returns, leaving all investment decisions and due diligence solely at your own discretion.

FVG Breakaway/3rd Candle (Arjo) [MK]Simple script to identify FVGs (Fair Value Gaps) on the current chart timeframe. The script differs from other FVG indicators on the Tradingview platform by using Arjos 3rd candle rule to identify which gaps are 'Breakway Gaps' and which Gaps are likely to be returned to.
NOTE: As with all 'trading rules' this theory is not 100% accurate.
default settings:
Breakaway Gaps = YELLOW
Gaps that price may return to = GREEN
Mitigated Gaps = 100% TRANSPARENT
What is a FVG:
A FVG is a price area defined by a 3 candle pattern. For a bullish FVG, the low of the 3rd candle must be higher than the high of the 1st candle. This then leaves an area that is drawn as in the example below:
A bearish FVG is defined by the high of the 3rd candle being lower than the low of the 1st candle, as shown in the example below:
FVGs can act like magnets where price will either retrace to or reach for, therefore they can be used as entry points and also for take profit target levels.
If for example, a trader would like to use an FVG for an entry, it would be useful to know which FVGs are more likely for price to re-enter and which FVG will be left un-touched. FVGs that are likely to be left un-touched by price are called 'Breakaway Gaps'.
How do we define a 'Breakaway Gap':
First we identify FVGs using the rules stated above, then we look to see where the 3rd candle closed in relation to the 2nd candle. For a bullish 'Breakaway Gap' we want to see the 3rd candle close above the high of the 2nd candle. An example of a bullish Breakaway Gap is shown in the example below:
A bearish 'Breakaway Gap' is defined by the close of the 3rd candle being lower than the low of the 2nd candle. An example is shown below:
How do we define an FVG that price may return to:
Any gap that does not meet the above rules for a 'Breakway Gap' is therefore considered an FVG that price may return to. So for a bullish FVG that price may return to we would look to see if the close of the 3rd candle is above the high of the 2nd candle. If it is not above the high of the 2nd candle then it more likely that price will retrace into the FVG before continuing higher. An example is shown below:
A bearish gap that price may return to is defined by the close of the 3rd candle not being lower than the low of the 2nd candle. An example is shown below:
The indicator is based on the teachings of 'Arjo'. Note: breakaway gaps will only remain 'breakaway' until a liquidity level is reached. Breakaways therefore do not remain 'breakaway' forever. Users of the indicators must fully comprehend this theory before using the indicator with live markets.
Users of the script should be fully aware of this concept and also have conducted thorough backtesting using a large data set before using this indicator with live accounts.

Pure FVG [Textbook]1. The Core Concept
This is not a standard "show all gaps" indicator. It is a specific entry signal generator based on Smart Money Concepts (SMC).
It focuses on Consequent Encroachment (The 50% Level). The underlying principle is that a Fair Value Gap (FVG) represents a market inefficiency where opposing traders are trapped. When price retraces at least 50% back into this gap, it creates pressure as these trapped positions look to exit—either through stop-losses or position reversal. This makes the gap most likely to act as a reversal zone.
2. How It Works (The Lifecycle)
The indicator logic follows a strict sequence of events. A signal is generated only if all conditions are met in order:
-- Phase 1: Identification (The Fresh Gap)
The script scans for the classic 3-candle FVG pattern (where the 1st and 3rd candles do not overlap).
Visual: It draws a box (Green for Bullish, Red for Bearish) extending to the right.
The 50% Line: A dashed line is drawn through the center of the gap.
-- Phase 2: Mitigation (The Gray Zone)
This is the critical filter. The indicator waits for a candle to CLOSE past the 50% dashed line.
Once this happens, the gap is considered "Deeply Mitigated."
Visual: The box changes color to Gray. This tells the trader: "Price is deep in the zone, watch for a reaction."
-- Phase 3: The Signal (Rejection)
Once the box is Gray, the script watches for a "Rejection Candle."
Bullish Scenario: Price is deep in the gap (Gray). The script waits for a candle to close higher than it opened (a green candle).
Bearish Scenario: Price is deep in the gap (Gray). The script waits for a candle to close lower than it opened (a red candle).
Visual: A Triangle Label (▲ or ▼) appears, signaling an entry.
-- Phase 4: Invalidation
If the price closes completely past the far edge of the box (the Stop Loss level), the box is deleted immediately.
3. Key Options
These are the most important settings for the user:
-- Min Gap Size (%):
Filters out "noise." It ensures the script ignores tiny, insignificant gaps that are less than X% in height.
-- Max Visible Gaps:
Keeps your chart clean. It limits how many open boxes can be on the screen at once (e.g., only show the last 3 unclosed gaps).
-- Show Signal History Only:
Feature Highlight: When enabled, this hides all the "noise" of open or failed gaps. It only draws the boxes that successfully produced a Rejection Signal in the past.
